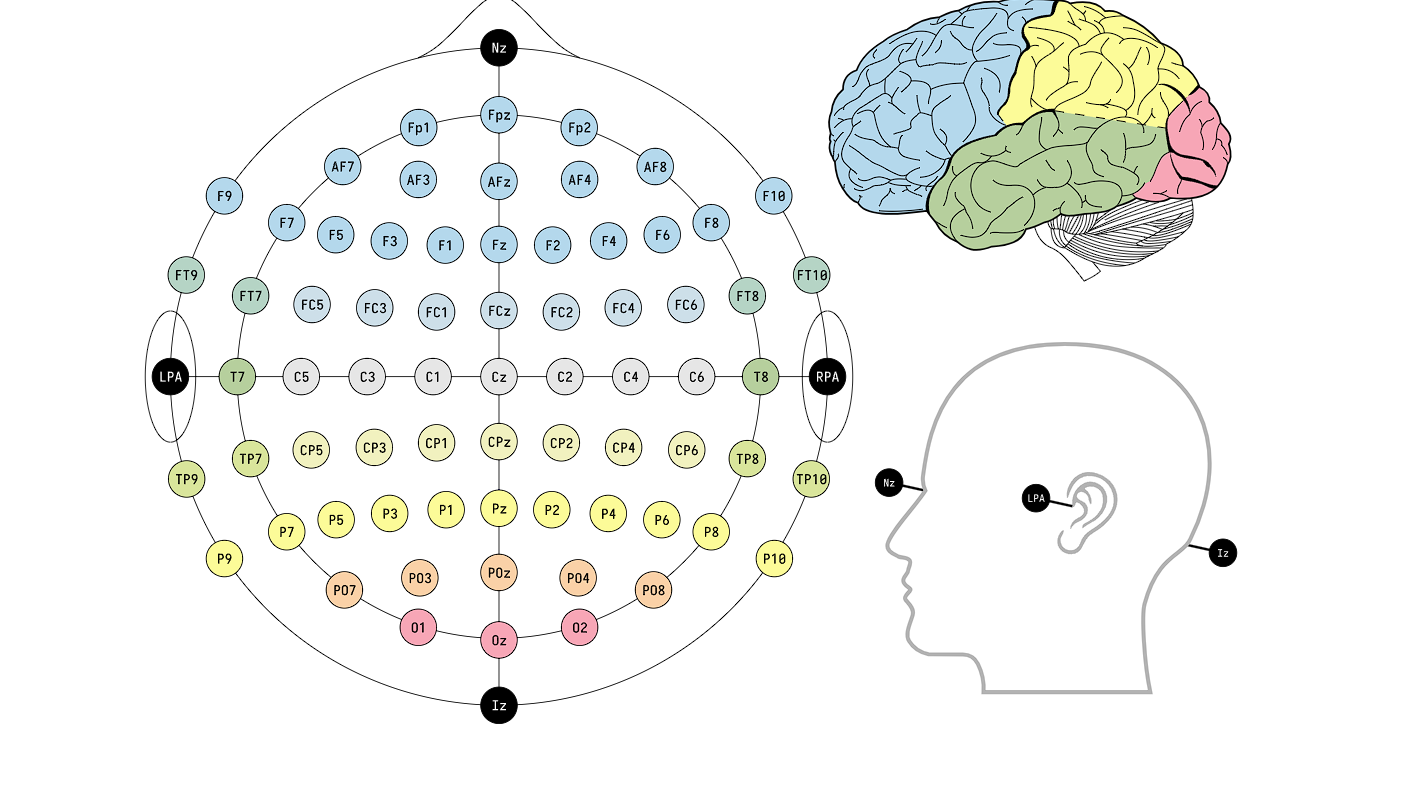
EEG (Electroencephalogram)
The gel helps to creates a connection between the electrode and the skin
The Nyquist frequency is half the sampling rate and represents the maximum frequency that can be accurately reconstructed without aliasing.
Barriers between brain and electrode include the skull, scalp, and cerebrospinal fluid. The skull is bone, but it has relatively low electrical conductivity, which attenuates signals.
EEG measures summed postsynaptic potentials (primarily cortical excitatory and inhibitory postsynaptic potentials), not action potentials.
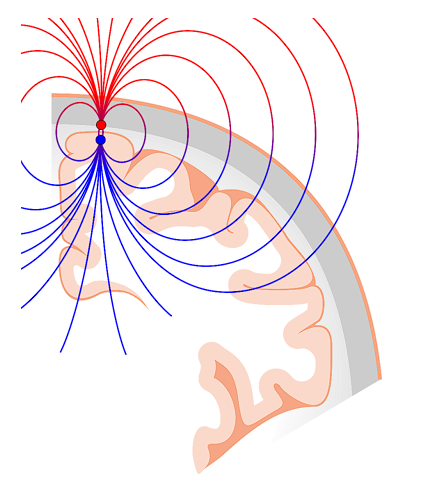
EEG signals are thought to arise from the synchronous postsynaptic potentials in the apical dendrites of large populations of cortical pyramidal neurons, particularly those oriented perpendicular to the cortical surface.
For a single dipole, there is distributed electrical activity in the surrounding tissue. In a perfectly spherical head model with a dipole source, the net potential over the entire scalp integrates to zero.
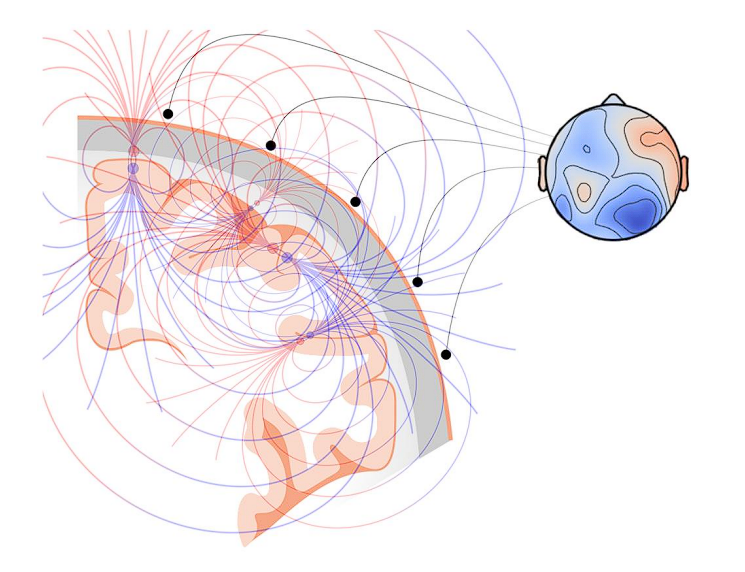
The reference used in EEG analysis can influence the conclusions, because the recorded signal reflects the superposition of many underlying dipolar sources, and different choices of reference change how these signals are represented
Other modalities
- Magnetoencephalography (MEG) measures brain activity by detecting magnetic fields generated by neuronal electrical currents. Like EEG, it reflects synchronous postsynaptic activity in cortical pyramidal neurons, but it is more sensitive to tangential cortical sources and is less distorted by the skull and scalp.
- Functional Magnetic Resonance Imaging (fMRI) indirectly measures brain activity by detecting changes in blood oxygenation using magnetic resonance signals. Neural activity increases metabolic demand, which triggers a compensatory increase in local blood flow that over-supplies oxygen, altering the ratio of oxygenated to deoxygenated hemoglobin. fMRI has high spatial resolution.
- Functional near-infrared spectroscopy (fNIRS) indirectly measures brain activity by detecting changes in blood oxygenation using near-infrared light. It works by emitting light into the scalp and measuring the amount of light that is absorbed and scattered by oxygenated and deoxygenated hemoglobin in cortical tissue.
- Electrocorticography (ECoG) records local field potentials from the cerebral cortex using electrodes placed directly on the cortical surface, providing higher spatial and temporal resolution than EEG due to the absence of skull-related signal distortion. ECoG signals are influenced by volume conduction, but the effect is greatly reduced compared to scalp EEG because the electrodes are placed directly on or near the cortical surface.
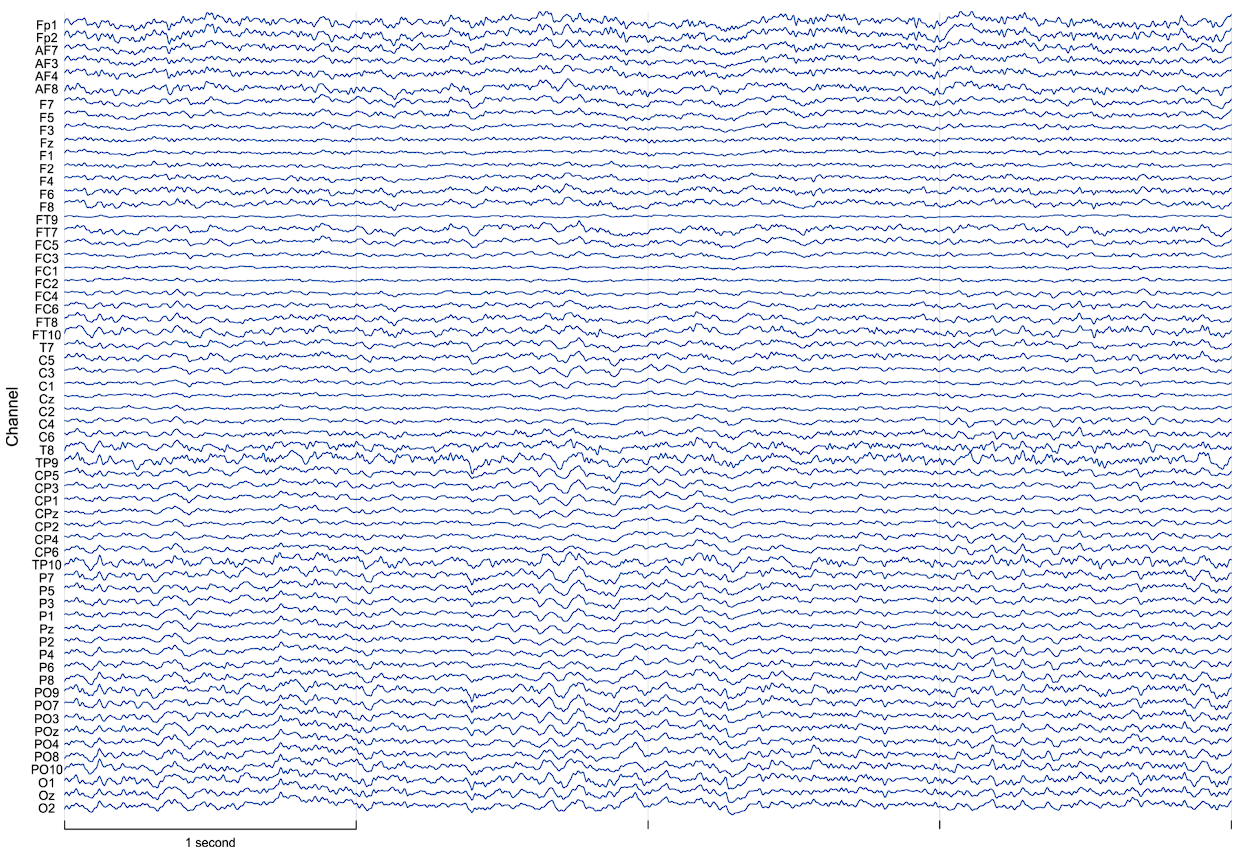
Spontaneous EEG activity refers to the brain’s ongoing electrical activity recorded at rest, without any explicit external stimulus or task.
| Band | Range |
|---|---|
| Theta | ~4–8 Hz |
| Alpha | ~8–12 Hz |
| Beta | ~13–30 Hz |
| Gamma | ~30–100+ Hz |
During navigation, the hippocampus exhibits strong theta oscillations.
Alpha waves are most prominent during relaxed wakefulness, especially with eyes closed, and decrease during active cognitive processing.
Gamma oscillations are high-frequency brain rhythms associated with local cortical processing and neural synchronization. They are generated by fast inhibitory-excitatory interactions and may contribute to feature integration and attention
EEG oscillatory bands are defined ranges, but their peak frequency and power distribution can shift depending on brain state (e.g., attention, fatigue, caffeine) and individual neurophysiology. These changes arise from neural circuit dynamics rather than skull size or head geometry.