LECTURE 4 & 5
EEG (Electroencephalogram) is the graphical representation of the electrical activity of the brain. The abbreviation EEG can refer to either electroencephalogram or electroencephalography.
Using EEG, brain activity is usually recorded at the scalp. EEG electrodes sit on the scalp, not inside every neuron. They can still measure voltage differences because electrical activity creates potentials that extend through surrounding conductive tissue.
The gel helps to creates a connection between the electrode and the skin
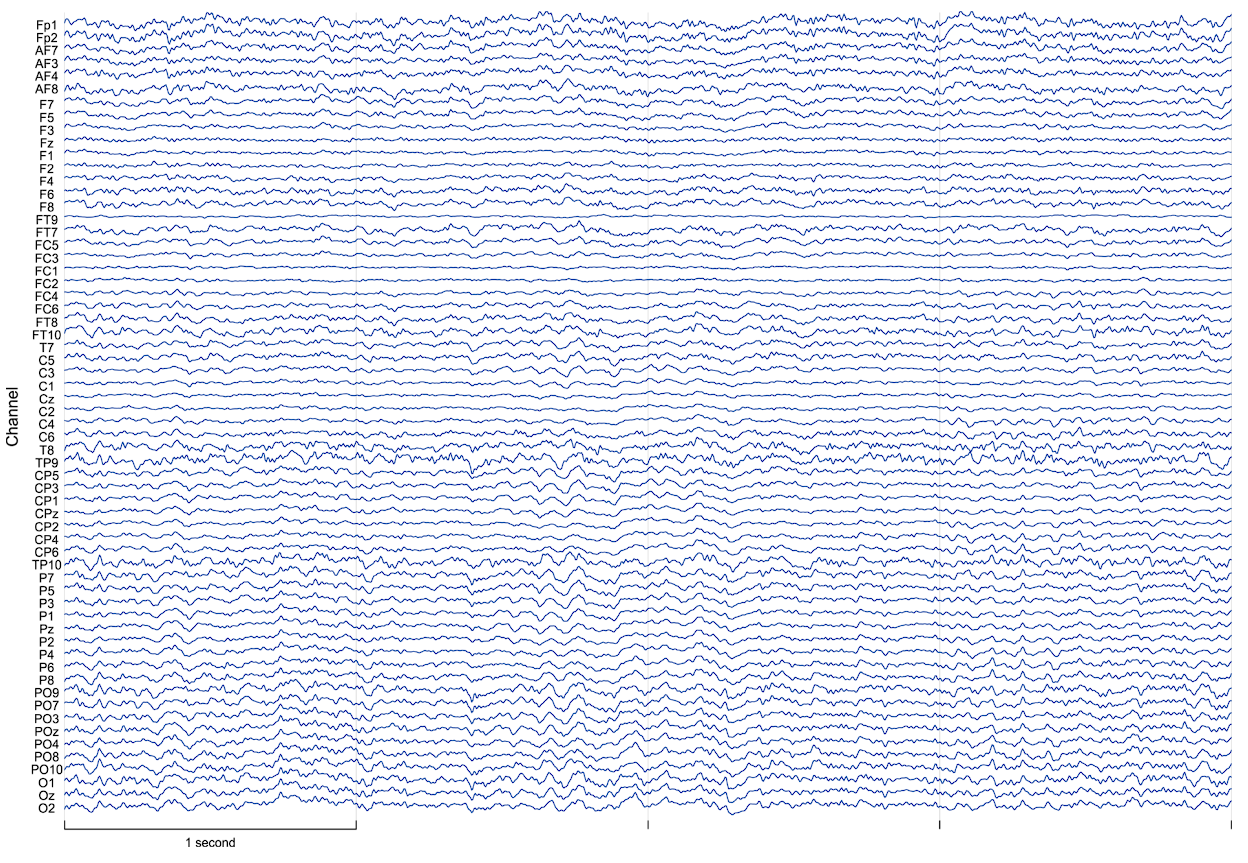
EEG does not measure an absolute voltage at one electrode. It measures a voltage difference between an active electrode and a reference electrode. The active electrode is placed near a region whose electrical activity we want to observe. Its potential is compared against the reference.
There is no electrically neutral reference location on the human body.
The reference itself also has electrical activity, so every EEG channel contains a relative difference involving that reference.
- Use a reference location with a good connection.
- Use a single reference for all electrodes.
The international 10–20 system Heads differ in size and shape. The system uses fiducial landmarks on the head:
- Nasion — front landmark near the bridge of the nose.
- Inion — posterior landmark at the back of the skull.
- Left and right pre-auricular points — near the ears.
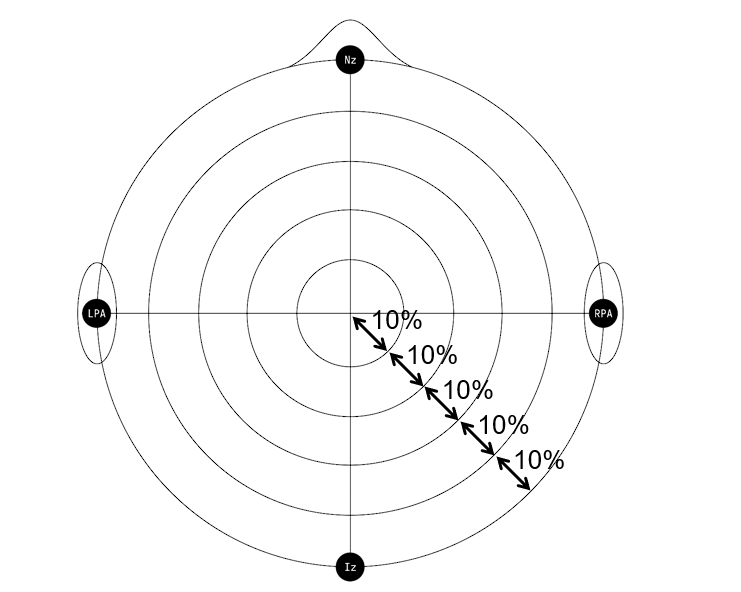
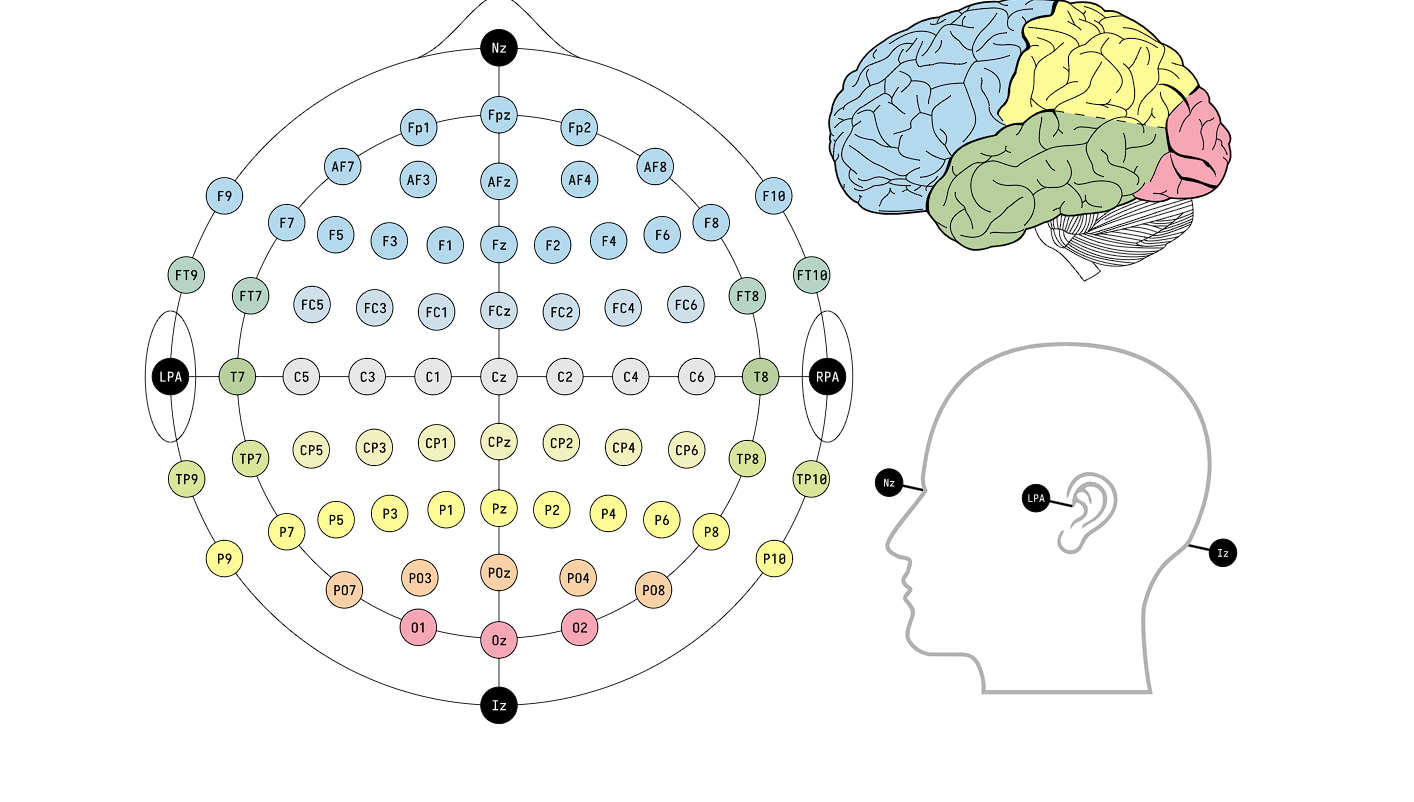
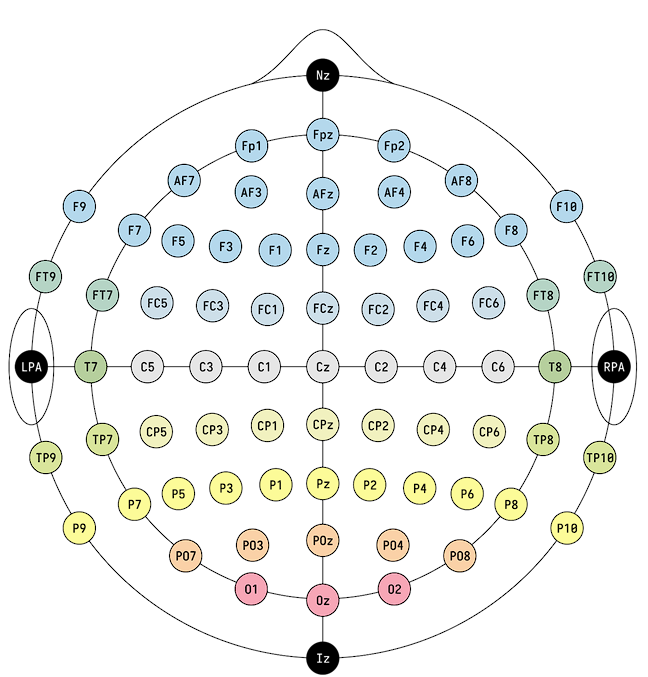
- Odd numbers = left hemisphere
- Even numbers = right hemisphere
- z = midline F – Frontal
C – Central
P – Parietal
O – Occipital
T - Temporal
Examples:
C3 = Central, left.
C4 = Central, right.
Cz = Central midline.
Even if an electrode is in the correct anatomical location, poor electrical contact with the skin can degrade the recording. The outer layer of skin contains dead cells and can create a relatively poor electrical interface.
To improve contact:
- The site can be cleaned with alcohol.
- The outer dead-cell layer may be abraded.
- A conducting electrolyte gel is usedThe electrolyte gradually diffuses into the outer skin and helps bridge the outer layer. It also provides better mechanical stability, meaning small movements are less likely to disrupt the electrode contact.
Digitization, Sampling, Aliasing Brain activity is continuous and analog. To save it digitally, the system records the signal at discrete time points called samples. The sampling frequency tells us how many samples are recorded per second. Example: 500 Hz sampling means 500 samples each second.
Aliasing : a high-frequency signal falsely appearing as a lower-frequency signal because the sampling rate is too low.
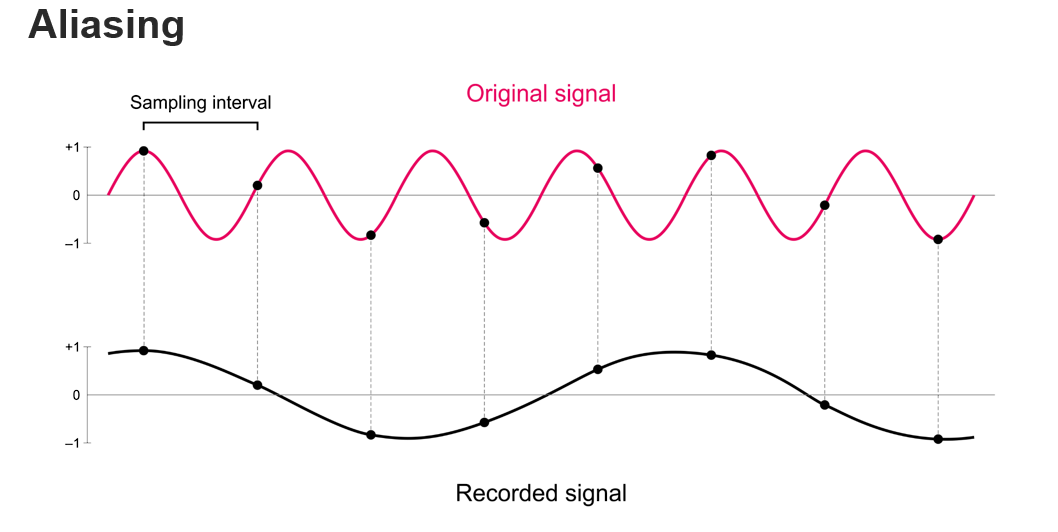 The sampled points fit a much slower waveform, so the recorded data falsely appears to contain a lower-frequency signal.
Real analog signal → sample at discrete times → numbers stored in computer → reconstruct/process a waveform
If the sampling rate is high enough, the reconstructed curve can represent the original signal accurately.
But with aliasing, the samples are too sparse. Then the same dots are consistent with a different, lower-frequency curve. The computer has no information between the dots that would let it discover the missing high-frequency oscillations. The computer can reconstruct the alias very accurately from the samples, while still being wrong about the original physical signal. That is why aliasing is dangerous: once the signal has been undersampled, you generally cannot recover the true high-frequency signal afterward from those samples alone.
Nyquist criterion The Nyquist frequency is half the sampling rate and represents the maximum frequency that can be accurately reconstructed without aliasing.
Nyquist frequency = sampling rate / 2
Frequencies above the Nyquist frequency are affected by aliasing.
Example : If your highest signal frequency is 10 Hz, then the Nyquist rule says:
So:
≥2×10=20 Hz
Meaning you need to sample at at least 20 samples per second to avoid aliasing in theory.
- Signal frequency = 10 Hz
- Sampling frequency = 20 Hz
- Therefore Nyquist frequency = 10 Hz
So a 30 Hz signal will NOT work correctly with a 20 Hz sampling rate, because:
30 Hz>10 Hz Nyquist
It will alias and appear as some incorrect lower frequency.
To correctly capture a 30 Hz signal, you need at least:
≥2(30)=60 Hz
Barriers between brain and electrode include the skull, scalp, and cerebrospinal fluid. The skull is bone, but it has relatively low electrical conductivity, which attenuates signals.
EEG measures summed postsynaptic potentials (primarily cortical excitatory and inhibitory postsynaptic potentials), not action potentials.
EEG signals are thought to arise from the synchronous postsynaptic potentials in the apical dendrites of large populations of cortical pyramidal neurons, particularly those oriented perpendicular to the cortical surface.
Pyramidal cells have an organised geometry in cortex. When large populations produce postsynaptic potentials synchronously and with compatible orientation, their electrical effects can sum instead of cancelling.
A single EEG electrode records activity from at least 10 million neurons, and possibly up to 1000 million.
EEG has relatively low spatial resolution.
The electric/voltage fields spread through the conducting tissues. This spread is instantaneous and the field reaches the scalp surface everywhere at once (volume conduction)
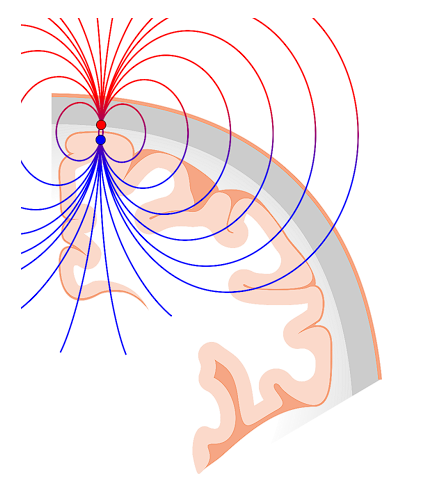
For a single dipole, there is distributed electrical activity in the surrounding tissue. In a perfectly spherical head model with a dipole source, the net potential over the entire scalp integrates to zero.
A single dipolar source can affect many scalp locations
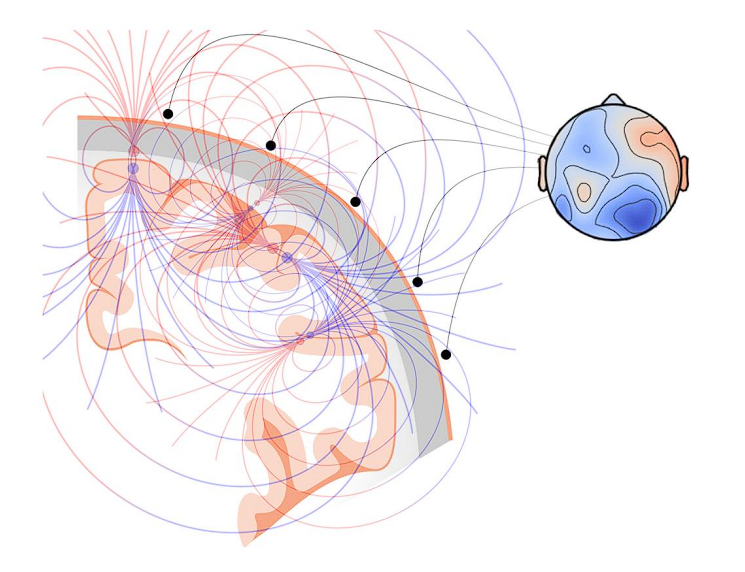
The reference used in EEG analysis can influence the conclusions, because the recorded signal reflects the superposition of many underlying dipolar sources, and different choices of reference change how these signals are represented. Even when a scalp region is primarily positively charged, the actual measured value also depends on the reference electrode
EEG advantages
- High temporal resolution : EEG can capture very rapid changes in electrical brain activity. This is a major advantage for BCI because online systems often need responses on short timescales.
- Relatively inexpensive
- Noninvasive
- Mobile
EEG disadvantages
- Low spatial resolution : millions of neurons contribute to each electrode and volume conduction spreads electrical fields across the scalp.
- No activity from deeper brain structures
- Complex signal that can interfere with itself : Different source orientations can add or cancel, and multiple brain sources contribute simultaneously to scalp channels.
Other modalities
- Magnetoencephalography (MEG) measures brain activity by detecting magnetic fields generated by neuronal electrical currents. Like EEG, it reflects synchronous postsynaptic activity in cortical pyramidal neurons, but it is more sensitive to tangential cortical sources and is less distorted by the skull and scalp.
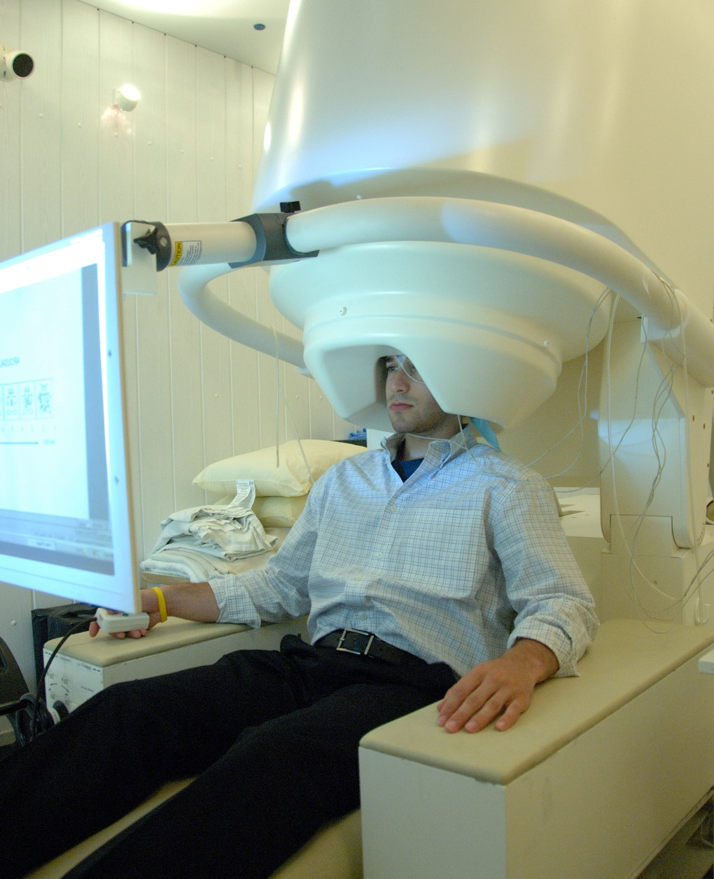
MEG advantages
- High temporal resolution
- Better spatial resolution : The skull and scalp are transparent to magnetism, so magnetic-field measurements are less spatially distorted by these tissues than scalp electrical potentials.
- Noninvasive
- Reference-free
MEG disadvantages
- No activity from deeper brain structures
- Expensive
- Stationary
- Functional Magnetic Resonance Imaging (fMRI) indirectly measures brain activity by detecting changes in blood oxygenation using magnetic resonance signals.
- Neural activity increases metabolic demand, which triggers a compensatory increase in local blood flow that over-supplies oxygen, altering the ratio of oxygenated to deoxygenated hemoglobin.
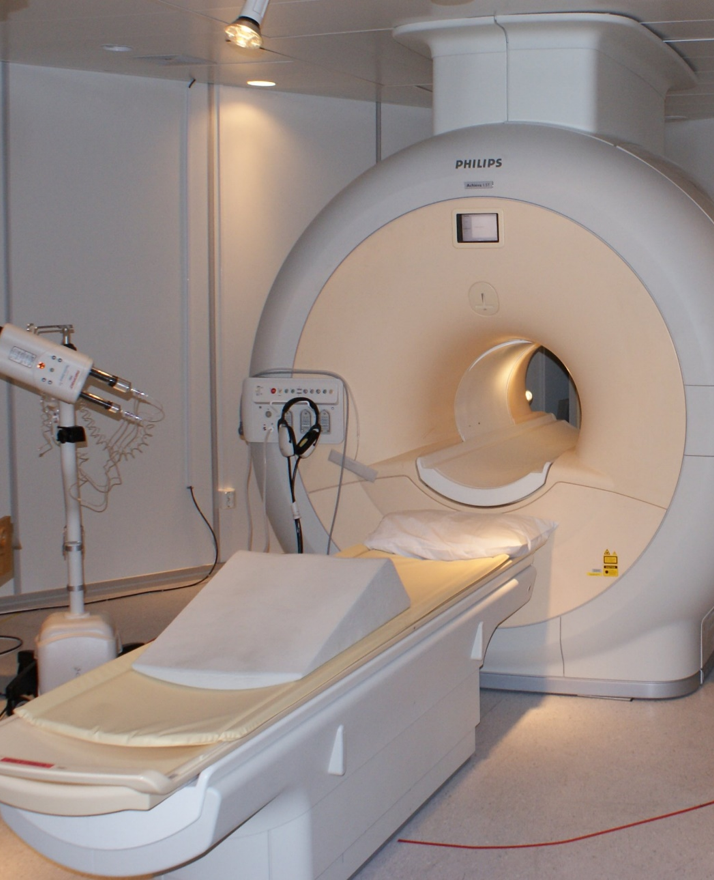
- Neural activity increases metabolic demand, which triggers a compensatory increase in local blood flow that over-supplies oxygen, altering the ratio of oxygenated to deoxygenated hemoglobin.
fMRI advantages
- High spatial resolution
- Can reach deeper brain structures
- Noninvasive
fMRI disadvantages
- Low temporal resolution : The measurement depends on the vascular/hemodynamic response rather than the fast electrical event itself, so changes evolve more slowly than EEG/MEG electrical signals.
- Expensive
- Stationary — participant is lying down
- Functional near-infrared spectroscopy (fNIRS) indirectly measures brain activity by detecting changes in blood oxygenation using near-infrared light. It works by emitting light into the scalp and measuring the amount of light that is absorbed and scattered by oxygenated and deoxygenated hemoglobin in cortical tissue.
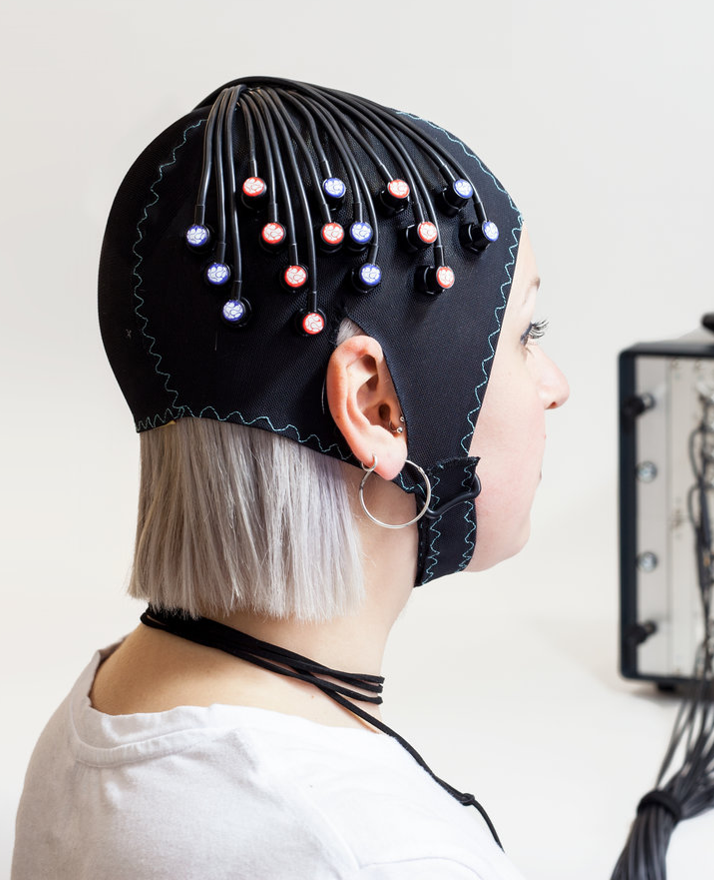
fNIRS advantages
- Clear spatial localisation of activity
- Relatively inexpensive
- Noninvasive
- Mobile
fNIRS disadvantages
- Low temporal resolution
- Low spatial resolution
fMRI and fNIRS both use blood oxygenation.
fMRI → magnetic fields
fNIRS → reflected near-infrared light
- Electrocorticography (ECoG) records local field potentials from the cerebral cortex using electrodes placed directly on the cortical surface, providing higher spatial and temporal resolution than EEG due to the absence of skull-related signal distortion.
- ECoG signals are influenced by volume conduction, but the effect is greatly reduced compared to scalp EEG because the electrodes are placed directly on or near the cortical surface.
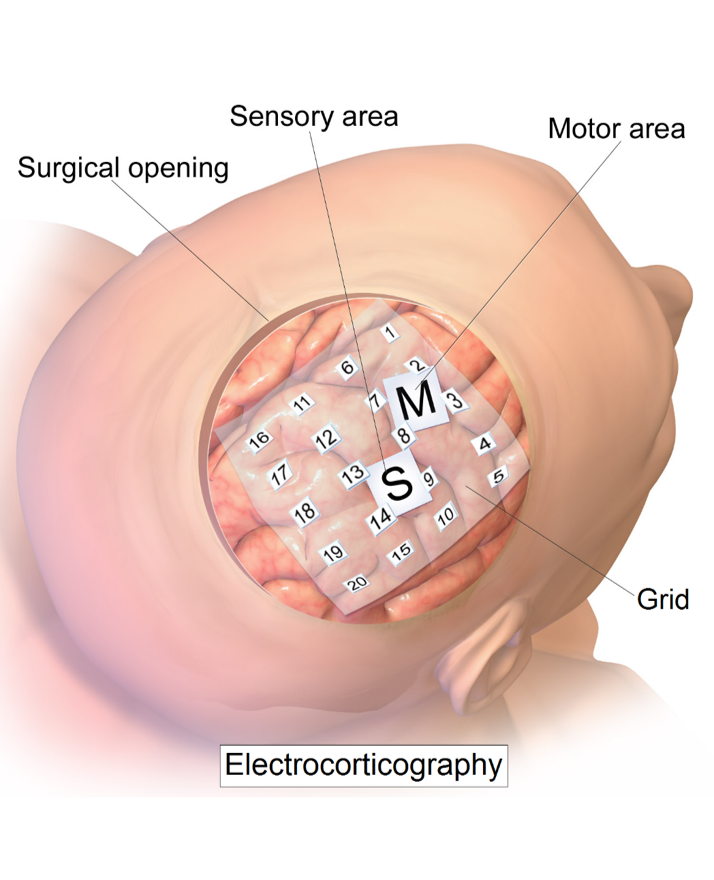
Advantages
- High temporal resolution
- High spatial resolution
- High signal-to-noise ratio : Because electrodes are directly on the cortical surface, the measurement is much closer to the generating neural populations and avoids much of the attenuation/spatial smearing associated with scalp measurement.
Disadvantages
- Highly invasive : requires surgery
- Usually limited to selected areas of the brain : Electrode grids are placed only where surgery exposes cortex; they do not normally cover the entire brain.
Spontaneous EEG activity refers to the brain’s ongoing electrical activity recorded at rest, without any explicit external stimulus or task. The brain does not become electrically inactive just because no stimulus is being presented.
The raw EEG is a complicated mixture of ongoing activity. Different oscillatory components are superimposed on each other. Different frequencies can be dissociated within spontaneous EEG activity.
| Band | Range |
|---|---|
| Delta | ~0.5–4 Hz |
| Theta | ~4–8 Hz |
| Alpha | ~8–12 Hz |
| Beta | ~13–30 Hz |
| Gamma | ~30–100+ Hz |
| ![[notes/BCI/images/Pasted image 20260811213637.png | 700]] |
Delta rhythm - 1–4 Hz
- Associated with phases of deep sleep.
- Deep sleep is therefore also called slow-wave sleep.
- Associated with release of several hormones.
- no known cognitive or affective correlates.
Theta rhythm - 4–8 Hz
- Associated with transition phases from asleep to awake.
- Associated with increased cognitive strain.
- Associated with processing new information.
- The slide also mentions hippocampal theta, but explicitly notes that this has little bearing on scalp EEG.
Alpha rhythm - 8–12 Hz The dominant regular frequency in human EEG, apart from bursts of delta activity. It is most prominent during:
- wakeful relaxation,
- eyes closed,
- especially over occipital sites.
Alpha desynchronization Alpha desynchronization = reduced alpha activity. Reduced alpha is associated with attention/cognitive work It is especially informative when combined with simultaneous theta synchronization, meaning increased theta activity.
Mu rhythm — 8–13 Hz Mu overlaps strongly in frequency with alpha, it is distinguished mainly by location.
Mu rhythm is associated with the motor cortex. The mu rhythm is strongest when the motor system is idle/resting — for example, when the person is not moving and not imagining movement.
When the person:
- moves,
- prepares to move,
- or imagines movement,
the mu rhythm typically decreases in power. This is called mu suppression or event-related desynchronization (ERD).
Alpha → especially occipital, relaxed eyes-closed state.
Mu → sensorimotor/motor cortex, related to motor inactivity and motor processes.
Beta rhythm - 12–30 Hz
- Associated with mental activity.
- Associated with physical activity.
- Often divided into lower and higher beta ranges, for example around 20 Hz.
Gamma rhythm — 30+ Hz
- Associated with attention.
- Associated with sensory processing.
- Associated with integration and association of information across distributed networks.
- 40 Hz “prototypical” gamma.
During navigation, the hippocampus exhibits strong theta oscillations.
Alpha waves are most prominent during relaxed wakefulness, especially with eyes closed, and decrease during active cognitive processing.
Gamma oscillations are high-frequency brain rhythms associated with local cortical processing and neural synchronization. They are generated by fast inhibitory-excitatory interactions and may contribute to feature integration and attention
EEG oscillatory bands are defined ranges, but their peak frequency and power distribution can shift depending on brain state (e.g., attention, fatigue, caffeine) and individual neurophysiology. These changes arise from neural circuit dynamics rather than skull size or head geometry.
- Peak frequencies vary across people.
- The boundaries vary across fields, time periods and experts.
- Do NOT equate frequency with one psychological function
EEG contains activity of all frequencies. All frequency bands are always represented in EEG.
A digital filter transforms the recorded samples so that some frequency components are preserved while others are attenuated.
A low-pass filter retains lower-frequency activity and suppresses higher-frequency activity.
A high-pass filter retains higher-frequency activity and suppresses lower-frequency activity.
EEG normally contains activity at all frequencies but at different power levels. Filters and other transformations let us investigate a frequency range of interest without treating the entire raw signal as one thing.
A power spectrum represents how much power the recorded signal contains at different frequencies.
Conceptually:
x-axis = frequency
y-axis = power at that frequency
A peak means that frequency contributes relatively strongly to the recorded signal.
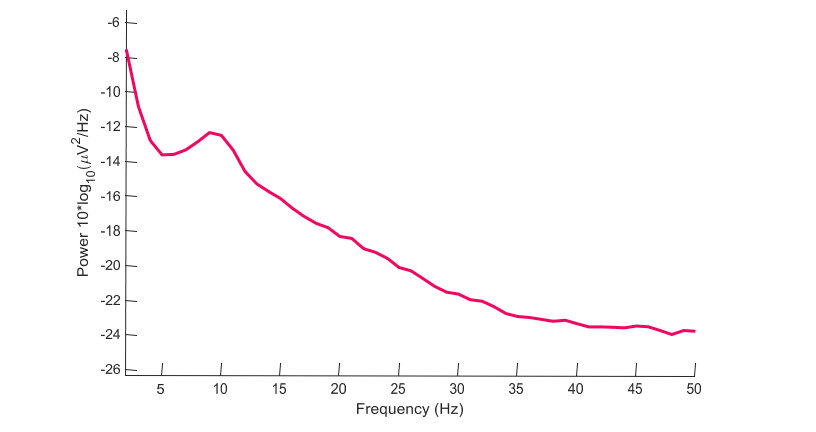
Basic Mu experiment
Participants repeatedly alternate between:
- rest, and
- grasping an object. The experiment compares Mu-band power over motor cortex across conditions.
Shows substantially larger Mu amplitude during rest than during execution.
This reduction in rhythmic Mu activity during movement is Mu desynchronization.
So:
Rest → stronger Mu rhythm
Movement → reduced Mu rhythm / ERD
The actual experiment had five conditions
- Rest
- Observe a flat-hand movement
- Observe a grasping hand form
- Observe someone grasp an object
- Grasp the object yourself
The Mu rhythm responded to both observed and executed movements.
So Mu modulation does not require the participant to physically execute the action.
The Mu rhythm also responds when movement is only imagined.
Motor-imagery experiments can ask participants to imagine movement of different effectors, such as:
- left hand,
- right hand,
- feet, etc.
Spatio = where on the scalp/cortex the spectral change occurs. Spectral = which frequencies/power levels change.
Therefore left- versus right-hand imagery is not distinguished simply because “Mu decreases.” It is distinguished by the spatial pattern of the frequency-power change.
The motor cortex is organised as a topographic map of the body and that organisation is contralateral.
Therefore:
Left-hand imagery → stronger sensorimotor change over right hemisphere
Right-hand imagery → stronger change over left hemisphere
Mu responds to observed, executed, and imagined movement, and different imagined movements generate different spatiospectral patterns because motor-cortex organization is topographic and contralateral.
Exp : Participants alternate between:
- rest, and
- a mentally straining task, such as arithmetic. The example shows repeated approximately 10-second blocks.
Workload is commonly associated with: Parietal decrease in alpha-band activity together with Frontal increase in theta-band activity.
High workload is not simply “theta exists.” Theta and alpha exist anyway. The useful information is the change in power between conditions and its spatial location.
High workload → decreased parietal Alpha + increased frontal Theta
Frequency analysis asks what frequencies are strong? Time-domain analysis instead asks whether the EEG changes systematically at a particular time relative to an event.
Event-Related Potential (ERP) A segment of EEG activity investigated relative to a specific event. Time 0 is normally the event we align the EEG around.
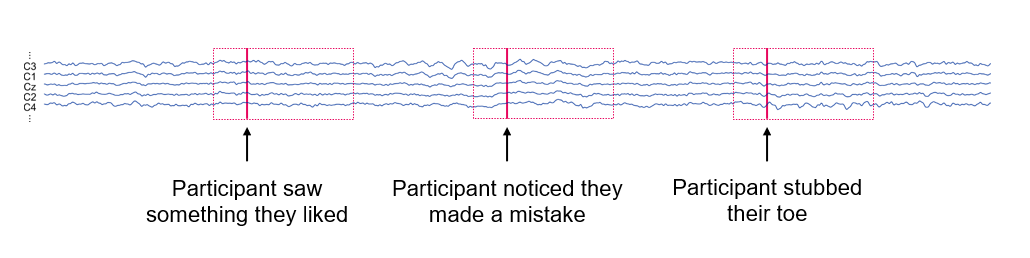
One single epoch contains:
- the activity related to the event, plus
- a huge amount of other ongoing brain activity.
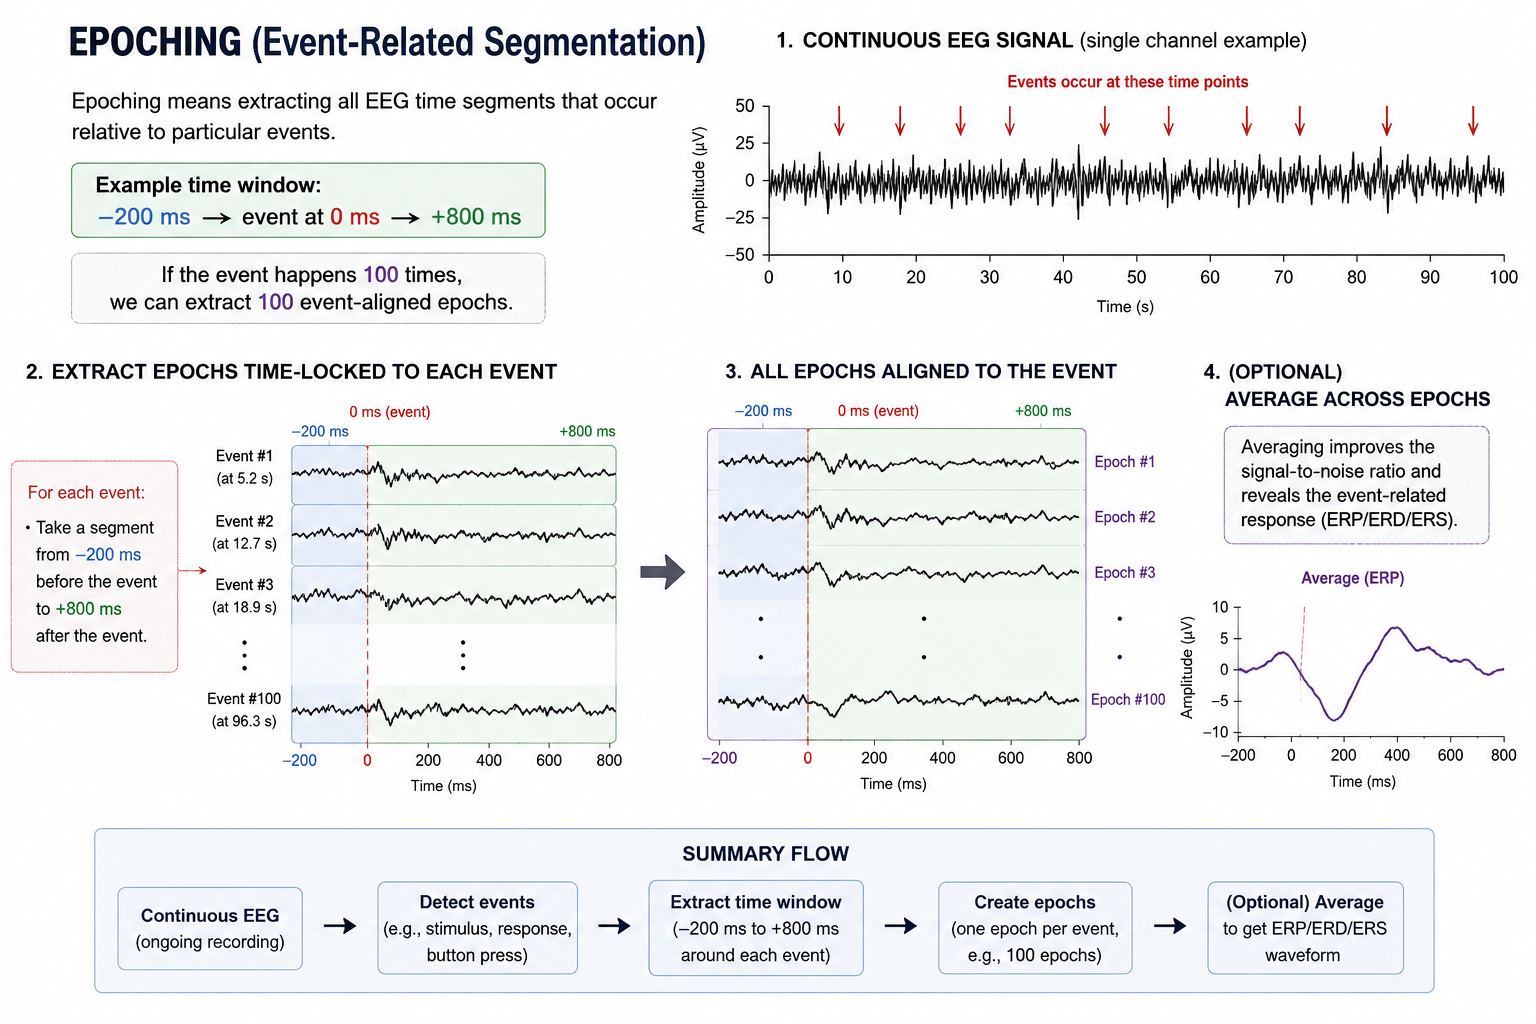
Epoching means extracting all EEG time segments that occur relative to particular events.
Example: −200 ms → event at 0 ms → +800 ms If the event happens 100 times, we can extract 100 event-aligned epochs.
ERP averaging :The epochs are averaged together. Activity that does not systematically vary relative to the event and baseline tends to average out. Activity that repeatedly occurs at the same latency relative to the event remains visible.
An ERP is EEG activity investigated relative to a specific event
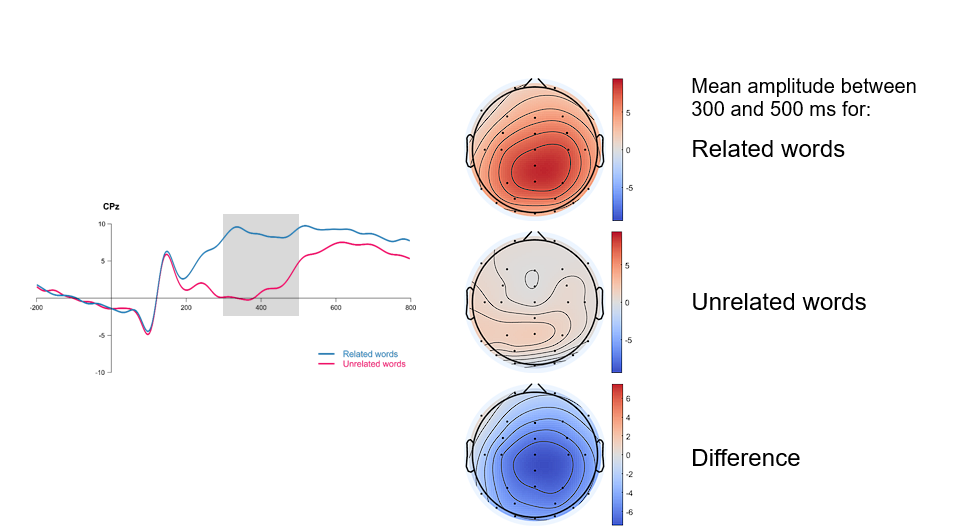
Word-semantics experiment
Participants see one word, followed by a second word that is either:
- related to it, or
- unrelated to it. Example shown: PEPPER → SALT.
The ERPs for related and unrelated words differ substantially after the second word.
To isolate the condition difference, the lecture subtracts one ERP from the other at every time sample.
Difference(t) = ERP condition A(t) − ERP condition B(t)
This makes the timing of the condition effect easier to inspect.
An ERP is not limited to one electrode. Topographically maps ERP amplitude from all channels. In the word experiment, the maps show mean amplitude from 300–500 ms for related words, unrelated words, and their difference.
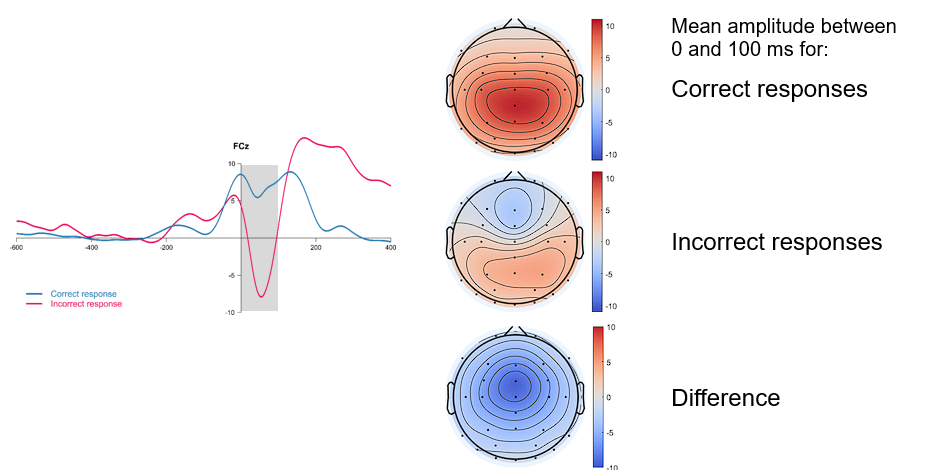
Flanker experiment
Participants see strings of arrows and must respond to the middle character.
The flankers are either:
- congruent — same direction, easier, or
- incongruent — opposite direction, confusing.
Then compares ERPs following correct versus incorrect responses.
The differential activity projects primarily onto frontal sites.
Analyse mean amplitude between 0 and 100 ms following the response.
Time-frequency analysis
Frequency analysis tells us which frequencies are active. ERP analysis tells us when voltage changes. Time-frequency analysis combines the two questions: which frequencies change, and when? It combines temporal and spectral information
Instead of calculating spectral power over a long recording, power can be estimated for smaller time periods. e.g. using wavelet transform
We obtain power as a function of:
frequency × time
So we can see, for example, whether theta power rises briefly 300 ms after an event while another frequency decreases later.
Go/NoGo-style button-press example
Participants attend to one coloured square out of five. They press a button when a stimulus appears in the attended square. This creates a well-defined manual response to which EEG activity can be time-locked.
Event-Related Spectral Perturbation : An ERSP shows changes in spectral power relative to a baseline, time-locked here to the manual response.
x-axis = time in milliseconds y-axis = frequency in Hz colour = power change relative to baseline in dB
The displayed scale ranges approximately from −3 dB to +3 dB.
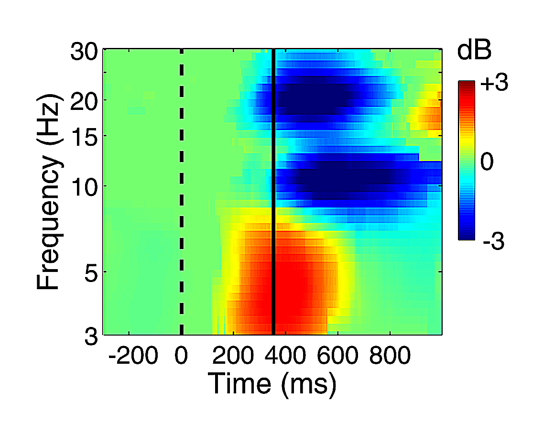
A normal power spectrum collapses over time and says: “How much power is present at each frequency?” An ERSP says: “How does power at each frequency change over time relative to an event/baseline?”
Time-Time Analysis
Traditional ERP averaging can hide important trial-to-trial variability. Time-time analysis keeps individual trials visible instead of collapsing everything immediately into one average
An ERP is often investigated as an average across many trials.
But individual trials can differ in:
- amplitude,
- timing,
- reaction time relationships. If we average first, some of this structure can be hidden.
Colour-code each single-trial ERP
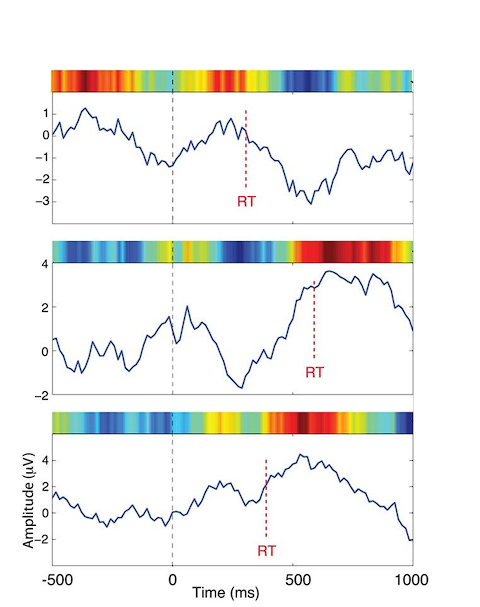
Each trial therefore becomes a horizontal strip showing how voltage evolves over time.
Stacking these colour-coded single trials creates an ERP image.
Conceptually: x-axis = time within trial y-axis = different trials colour = ERP amplitude
Then vertically re-sorts the trials by reaction time.
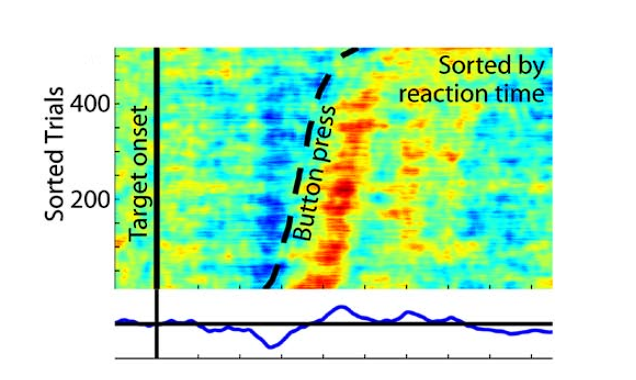
After sorting, ERP effects that were difficult to see in original trial order become much clearer.
If a neural effect shifts in time depending on reaction time, averaging all trials together can smear it. Sorting trials by reaction time allows that relationship to become visible as a structured pattern across trials.
BCI research
- invasive BCI : Drill holes into skull, keep electrode in the brain
- Interference is minimized
- Tissue is damaged; implanted electrodes currently have only a short functional life
- ECoG (Electrocorticogram) is a primary method used
- Non-invasive :
- Data are implicitly derived from physical states of the brain
- Methods used :
- EEG (Electroencephalogram): Measures the brain’s electrical activity using electrodes placed on the scalp. This is the most common, portable, and cost-effective BCI method.
- fMRI (Functional Magnetic Resonance Imaging): Measures brain activity by detecting changes in blood flow and oxygenation (hemodynamic response). It offers excellent spatial mapping but requires massive, expensive machinery.
- NIRS (Near-Infrared Spectrogram / Spectroscopy): Uses near-infrared light beamed through the skull to measure blood oxygenation levels in the cerebral cortex. It is more portable than fMRI but has lower spatial resolution.
Data generation
- Synchronous (Cue-Based): The system dictates the timing. The participant only performs a mental task when prompted by a specific cue or stimulus from the computer (e.g., “Imagine moving your left hand now”).
- Asynchronous (Self-Paced): The user is in total control. They can generate brain patterns whenever they choose, and the BCI must continuously monitor the brain state to detect these voluntary changes without waiting for a prompt.
Data Processing:
- Causal = Real-Time (No Future Info)
- Non-Causal = Offline Analysis (Needs the Full Dataset)